NYC Ferry Ridership Forecasting
Hourly stop-level passenger demand forecasting using Machine Learning and Semantic Web Ontologies.
Project Overview
This end-of-year project focuses on predicting hourly NYC Ferry passenger demand at a stop level. What makes it different from a standard forecasting project is the use of ontology-driven feature engineering. By combining Semantic Web technologies (OWL, SWRL) with traditional machine learning, the pipeline injects domain knowledge about transit operations, weather conditions, and route behavior directly into the model inputs.
The current best result comes from a global Ridge Regression model, which reaches approximately 46% WMAPE on the holdout evaluation. The project also includes comparisons against other model families such as LightGBM and other baselines.
This project was developed in collaboration with Khadija Kammoun.
Project Index
This portfolio page is organized to give a fast understanding of the full project:
- Problem: forecast stop-level NYC Ferry demand by hour.
- Data: ridership, weather, wind, holidays, and ontology-generated features.
- Feature engineering: lags, rolling windows, temporal encodings, calendar effects, and domain flags.
- Modeling: Ridge Regression, LightGBM, and other comparison models.
- Evaluation: holdout forecasting with error metrics such as WMAPE.
- Visualization: route, stop, seasonality, weather, and model-comparison plots.
Interactive Map Demo
This project incorporates an interactive map demo that bridges the spatial network geometry with the forecasting pipeline. Exploring model inferences through a visual, map-based interface provides an immediate, product-style view of how these models operate in a real-world transit application.
Key interactive features:
- Route Selection: The network's six principal routes are structured as distinct, color-coded layers.
- Dynamic Highlighting: Selecting a route highlights that specific corridor while fading or hiding the other routes to eliminate visual overlap.
- Stop & Direction Targeting: Once a route is highlighted, users can click any stop marker along with a travel direction (inbound/outbound) to define the prediction context.
- 10-Day Prediction Output: These selections instantly trigger a short-term forecast, displaying the next 10 days of expected passenger boardings via a clean chart and a summary panel.
Key Highlights
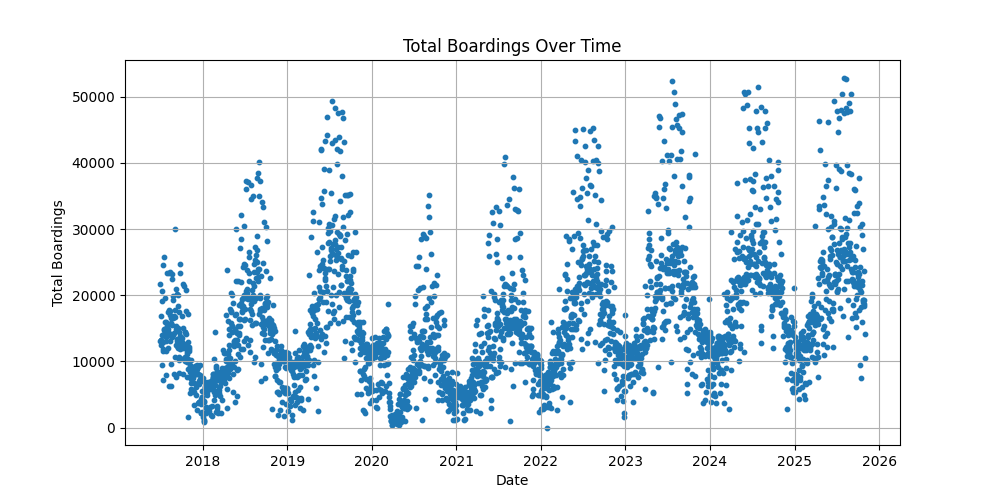
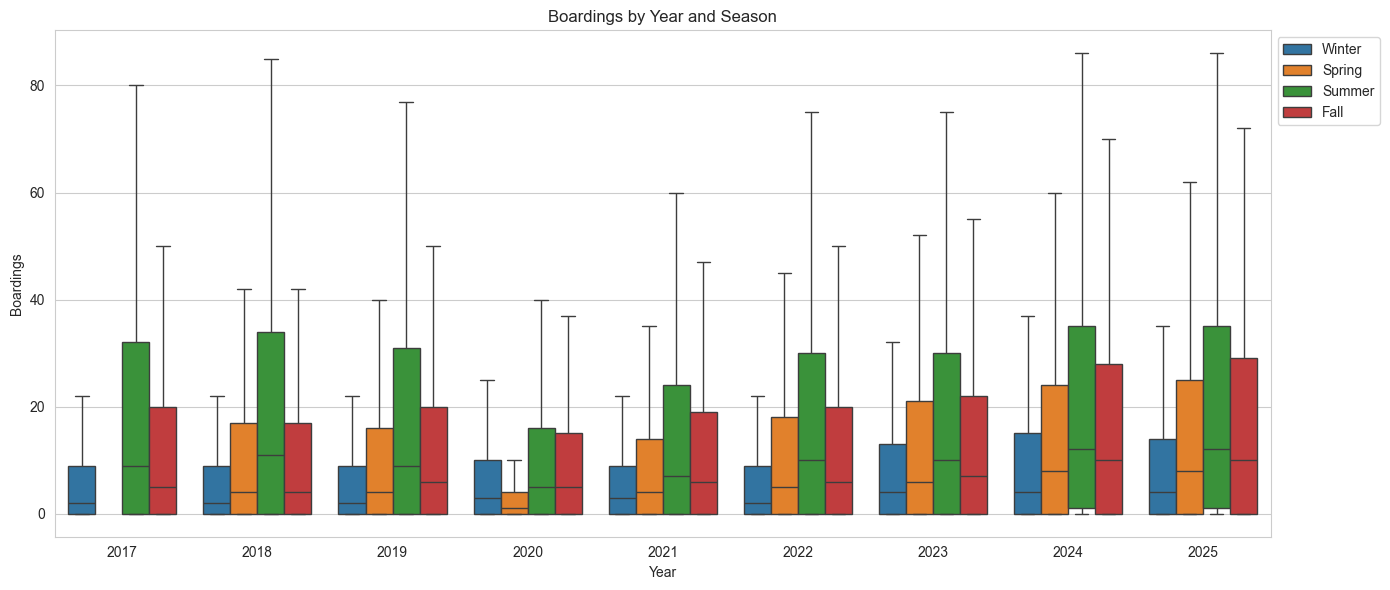
Understanding ridership trends was critical for model engineering. The data shows strong daily, weekly, seasonal, and weather-driven variation.
Data and Demand Patterns
- Total boardings over time show the broader evolution of demand.
- Boardings by hour highlight commuter peaks during weekdays and different weekend behavior.
- Seasonal boxplots reveal recurring monthly and seasonal variation.
.png)
Route and Stop Analysis
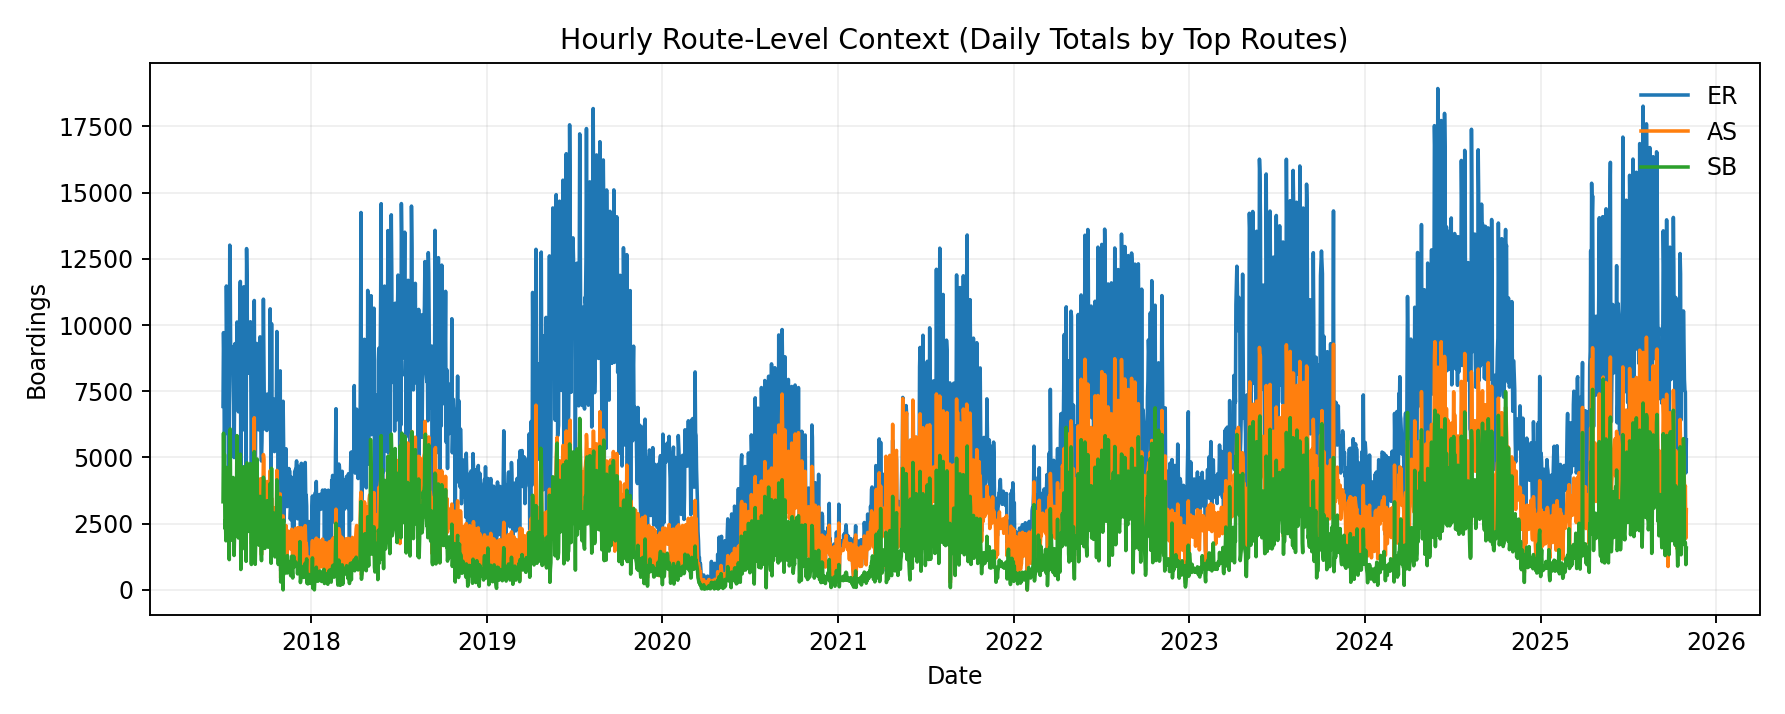
- Top routes show which corridors carry the highest demand.
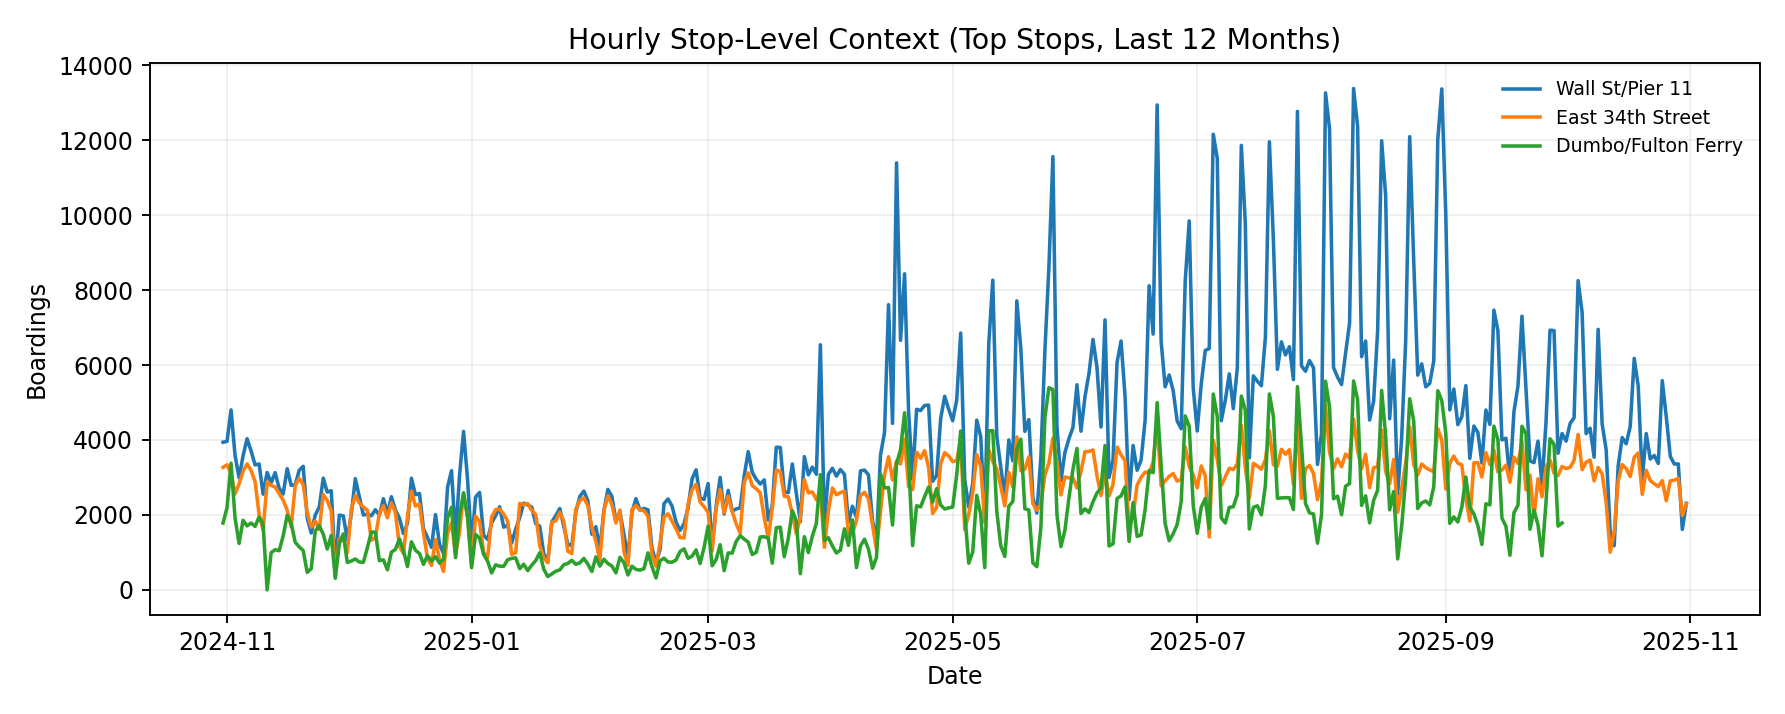
- Top stops last year identify the strongest hubs and transfer points.
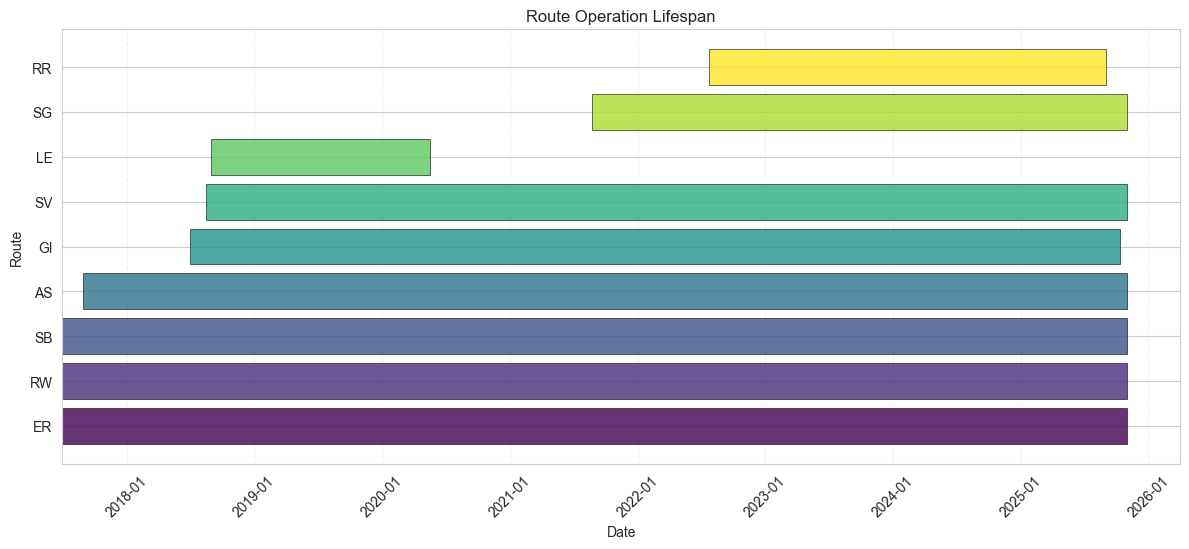
- Route lifespan helps explain how long each service has remained active.
How It Works
The forecasting pipeline is structured into three main pillars:
1. Feature Engineering
We constructed robust tabular datasets integrating:
- Temporal Features: Cyclical representations (Hour, Day, Month sine/cosine), lag features (24h, 168h), and rolling means.
- Exogenous Data: Live weather (temperature) from Open-Meteo, wind gusts/speed from NOAA, and US Holidays.
2. Data Preparation and Splitting
The modeling workflow uses carefully separated train, validation, and holdout periods so that the evaluation remains realistic for forecasting.
3. Domain Ontology Injection
Instead of relying solely on raw data, we built a domain ontology (ferry_wind_ontology.owl).
- We defined entities such as routes, stops, temporal context, and weather events.
- We used Semantic Web Rule Language (SWRL) rules to classify weather severity and peak or holiday traffic states.
4. Machine Learning Modeling
We evaluated several algorithms (Ridge Regression, LightGBM, XGBoost, Prophet). To avoid data leakage, we utilized a recursive forecasting pipeline. The Ridge Regression model proved to handle collinearity gracefully, especially between historical lags and the augmented ontology features.